Share
Share

28.03.2022
Our blog topic for today is Google PageSpeed Insights, which is used to measure site speed and is undoubtedly trusted by many because it is Google’s own tool.
Before we talk about Pagespeed Insights, let’s talk about the importance of site speed in terms of SEO.
Site speed, which has become an important factor for the last 7 years by the digital world, has become a very important factor especially in terms of SEO (Search Engine Optimization).
One of the main reasons for this is that Google’s statement in 2018 is that site speed is one of the ranking factors, and the second is to keep the visitor on the site by providing a fast-loading page in terms of user experience.
With the increase of mobile users, having a fast-loading web page has become a necessity. It has been proven that the speed of the web page is an important determinant of visitor behavior.
Note: Google research has concluded that you will lose half of your potential visitors / customers due to pages that load after 3 seconds.
Google PageSpeed Insights is a Google tool that informs you about metrics and errors that slow down your site’s speed.
You don’t need to own a website to use Pagespeed Insights and you can analyze any page as many times as you want.
PageSpeed analyzes your website and gives you various suggestions to make it faster. PageSpeed Insights, which collects many metrics, creates an overall report for you to increase the speed of your site and correct your deficiencies in terms of usability.

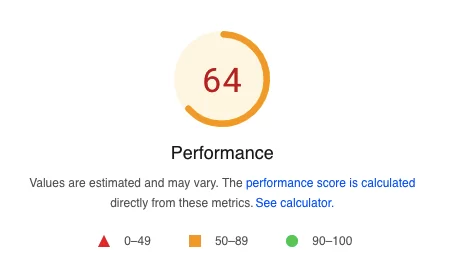
The performance score takes a value between 0 and 100. Between 0 and 49 is considered bad, between 50 and 89 can be improved, between 90 and 100 is considered good. So how is this value obtained? Let’s see what metrics are used.
While calculating the performance score, the calculations are made using the metrics FCP (Initial Content Paint), SI (Speed Index), LCP (Largest Content Paint), TTI (Interaction Time), TBT (Total Blocking Time) and CLS (Cumulative Layout Shift) to get more detailed information. You can refer to the source below.
Link: https://googlechrome.github.io/lighthouse/scorecalc/
FCP is a metric that results from calculating the time elapsed between the time a web page starts to load and the loading of the first element visible to the user. The other part that distinguishes FCP from other metrics is that it focuses not only on the codes running in the backend, but also on the user experience (UX) and which element is loaded first on the site.
The first meaningful paint is a PageSpeed metric that measures when the primary content of a web page is visible to the visitor. FMP occurs by measuring the time, in seconds, that the first content is displayed to the user from the time the page first starts to load.
0 to 2 seconds means FMP speed is good. 2 to 4 seconds indicates that the page speed is medium and open for improvement. Over 4 seconds means the speed is bad and definitely needs improvement.

It is one of the site speed metrics that came into our lives with the CLS web vitals core update. CLS is a metric that measures the visual stability of the page between opening and loading the site when users visit a page. It usually occurs when the visual codes (Width and Length) of the pages are not specified to the browser.
A score between 0.00 – 0.1 is shown with a green color and is a pass. A score between 0.1 – 0.25 is shown in yellow and is at an acceptable level but still needs improvement. A score above 0.25 is displayed in red and it is very bad, urgent intervention is required.
LCP is the time from the time the user’s website starts to load until the largest visible content item in the viewport is loaded.
Structures included in Largest contentful paint measurement evaluations;
0 – 2500 ms (Milliseconds) is called fast and is valid. Between 2500 – 4000 ms is considered medium and open to improvement. 4000 ms and above require urgent intervention because loading our biggest item so slowly will cause great damage to our site in terms of site speed and user experience.
First Input Delay is the measurement of the delay between when a user first interacts with the website and the browser starts processing the action. Browsers usually have a latency period of a certain amount that we need to keep this latency at an acceptable level for our site.
So what is acceptable time? Between 0 and 100 ms (milliseconds) is considered good. It is open to development between 100 and 300 ms. Over 300 ms is considered bad and causes great damage to our site in terms of user experience, so a study should definitely be done.
Speed Index is one of the 6 metrics in the performance section of the PageSpeed report. Speed index shows how fast a web page is loaded visually. It does the speed index calculation in seconds, so the more you reduce the visual loading time of your web page, the better it is for your page. In order for your web page to load faster, examining and applying the data given in the PageSpeed diagnostic section will benefit both your performance score and speed index metrics.
0 to 3.4 seconds fast (good). 3.4 to 5.8 seconds is medium and needs improvement. If it is more than 5.8 seconds, it is bad and should definitely be intervened.


It gives successful or failed results based on the results of these metrics.


Perfist Blog
Similar Articles

Regularly monitoring the destination URLs of your Google Ads campaigns is one of the most effective ways to protect your ad budget. Broken or misdirected pages waste paid clicks, lower your Quality Score, and hurt your conversion rates. In this article we’ll walk you step-by-step through building an automation system that exports Google Ads destination […]
Read More
Senior Level Performance Marketing
In this guide, we will explain what a session is in Google Analytics 4 (GA4), why session duration matters, which session metrics are available, and how to configure these settings. What is a Session in GA4? A session represents the group of interactions a user has with your website or mobile app within a given […]
Read More
Beginner Level Web/App Analytics
What is GEO (Generative Engine Optimization)? GEO is a new generation optimization method that ensures content stands out in AI-supported search systems. It aims to produce content that can provide quick and clear answers to user questions. In addition to traditional SEO, a simple and understandable language that appeals to artificial intelligence is used. Why […]
Read More
Mid Level SEO
GEO is an optimization method developed to ensure that content is better understood and recommended by AI-powered search engines. Previously, when writing content, the goal was solely to rank high on Google. Now, however, AI systems read these contents and present summaries to users. This is exactly where GEO steps in. It ensures that content […]
Read More
Mid Level Content Marketing